Evaluating Headphones
How We Evaluate Headphones
Our experience comes from conducting thousands of headphone reviews over two decades.
We work hard to help you find the best headphones. Every pair of headphones sold at headphones.com must complete an extensive testing and evaluation procedure conducted by our expert sales team:
- We use and handle every headphone, comparing their features & sound to similar models.
- Test them with various gear and in the field if they're designed for specific activities.
- Conduct group training sessions and complete evaluation forms.
- Most headphones go through a rigorous measurement test. We believe a pair of ears and real-time use are ultimately the best ways to test headphones, but measurements are a helpful tool to provide objective data for comparison purposes.
Learn More About Headphones.com Headphone Measurements
Our measurement data is straight off the scope, so to speak. Unless you're an engineer, you're likely not going to understand the whole meaning of the peaks and dips in the graphs. The important thing to know generally is, the fewer the better. Headphones are notoriously difficult to measure, and even the very best headphones have complex graphs. So, look for simple results but don't be surprised by a lot of wiggles—they are normal. And take everything with a fairly good-sized grain of salt.
You can compare headphone performance and build your own headphone graphs with our Build-A-Graph tool.
Frequency Response

What it means: Frequency response is the measure of a headphones ability to reproduce all frequencies equally. Theoretically, this graph should be a flat line at 0dB. The left-hand side of the line is the bass, the right side is the treble. If the line is high on the left and low on the right, the headphones would be considered bass heavy. If the line is low on the left and high on the right, the headphones would likely be “bright” sounding with an emphasis on the highs and lean bass response.
How we test frequency response: To perform this test we drive the headphones with a series of 200 tones at the same voltage and of ever-increasing frequency. We then measure the output at each frequency through the ears of the highly-specialized (and pricey!) Head Acoustics microphone. After that, we apply an audio correction curve that removes the head-related transfer function and accurately produces the data for display.
How to interpret the line: A “natural sounding” headphone should be slightly higher in the bass (about 3 or 4 dB) between 40Hz and 500Hz. This compensates for the fact that headphones don't give you the physical punch or 'impact' that the sound waves from a room speaker have; so a slight compensation for increased bass response is needed for natural sound.
Headphones also need to be rolled-off in the highs to compensate for the drivers being so close to the ear; a gently sloping flat line from 1kHz to about 8-10dB down at 20kHz is about right. You'll notice all headphone measurements have a lot of jagged ups & downs (peaks & valleys) in the high frequencies; this is normal and mostly due to reflection cancellations in the folds and ridges in the outer part of the ear. Ideally, however, the ups and downs of the frequency response should be fairly small and average out to a flat line. Large peaks or valleys over 3kHz in width usually indicate poor headphone response and should be viewed as a coloring of the sound. Some small dips in the highs may actually be desirable and should exist in the 2kHz to 8kHz region.
Harmonic Distortion
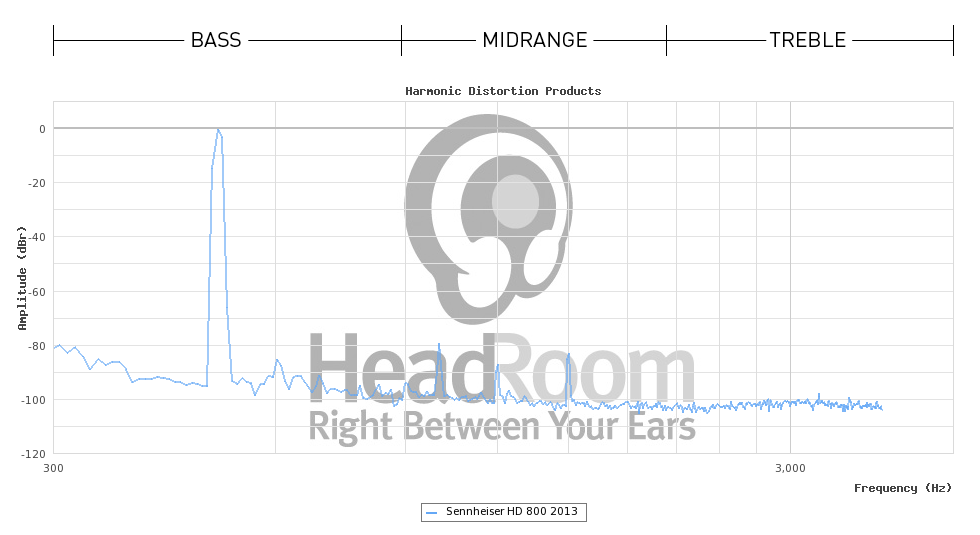
What it means: When you put a single tone, say 500 Hertz, into the headphones, you should only get a single tone out. But if the headphones are “non-linear” you will get some extra energy out at other frequencies. These are called “distortion products” and happen at multiples of the fundamental test tone. In the case of a 500Hz tone, the 2nd harmonic would be at 1000Hz; the third harmonic at 1500Hz; the forth at 2000Hz, etc.
How to interpret the line: Theoretically, the perfectly linear headphone would have no harmonic peaks whatsoever; in practice, this is rarely the case. The full poindexter discussion is complex, but the general wisdom is that distortion is less audibly disturbing when each peak gets smaller as the frequency goes up AND that the second harmonic is not nearly as disturbing as the third.
Generally, it is our experience that tight, clean, articulate-sounding headphones have few harmonic distortion products. Headphones that sound lush (thought to be the even harmonics) or hard and/or grainy (thought to be the odd harmonics) probably have a lot more harmonic distortion. It is our experience, however, that some very good-sounding headphones have a significant amount of harmonic distortion, so it would be wrong to assume that just because there are a lot of distortion products that the headphones sound bad. It's just not the case. The ears have to be the guide here!
Impedance Measurement
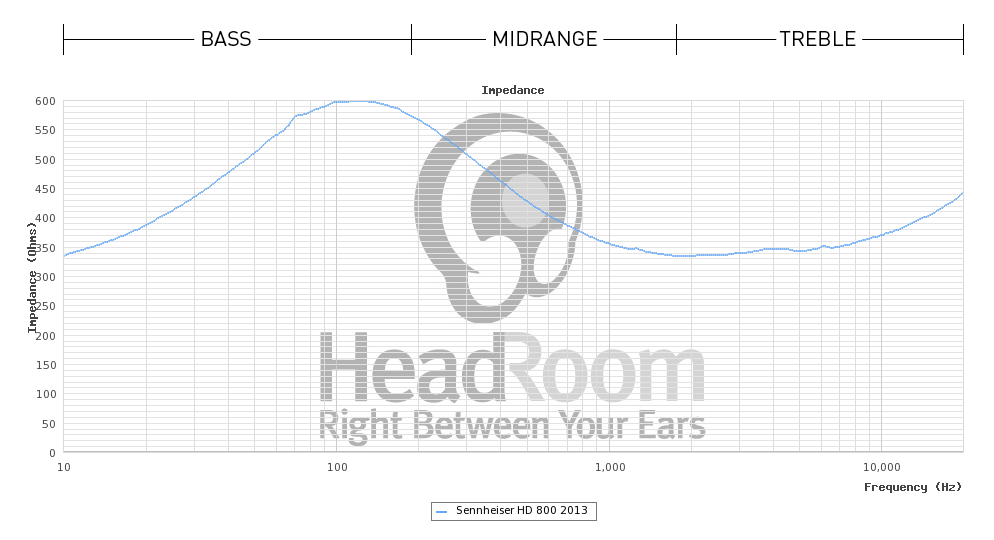
What it means: The headphone impedance plot is a measure of the dynamic resistance in ohms of the headphones over the entire audible frequency range.
How we measure: This measurement is accomplished by measuring the voltage drop before and after the output impedance resistor of our Audio Precision tester and doing a simple voltage divider calculation at each frequency.
How to interpret the line: The first large peak in the plot generally represent the location of the driver resonance. The overall height above zero is the impedance of the headphone. The general trend in headphones over the past decade is a gradual lowering of impedance. Generally, the lower impedance the headphone, the easier it is to get higher volume. But, once a headphone goes below about 20 ohms it starts requiring a lot of current and may become hard to drive again. The best measure for seeing how easy it is to drive a headphone is our voltage required to get 90dB measurement.
Isolation Measurement
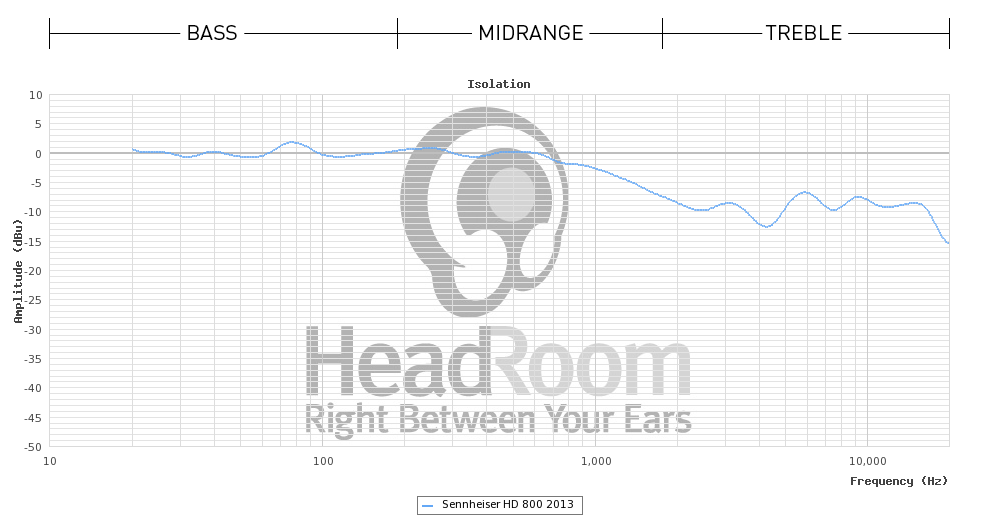
What it means: This is a measure of a headphone's ability to isolate the listener from external ambient noise. If there is no attenuation the line will be flat. If the headphone attenuates outside sound, the graphed data will begin to get lower, which represents a reduction of sound level at those frequencies.
How we measure: In this case, we measure the Head Acoustics response to pink noise generated by a speaker mounted about one meter from the head. Then we simply put the headphones on the head and measure the spectrum of sound the head “hears”. We then calculate the difference between the two measurements to calculate how much noise attenuation the headphones are providing over the entire audible frequency range.
Even open headphones cut out a moderate amount of noise above 3kHz. Most sealed headphones will provide significant amounts of attenuation down to a few hundred Hertz. Noise-canceling headphones will sometimes extend this attenuation down just below 100Hz. In-ear headphones, and particularly Shure and Etymotic, have the best isolation by far.
500 Hz Square Wave Response
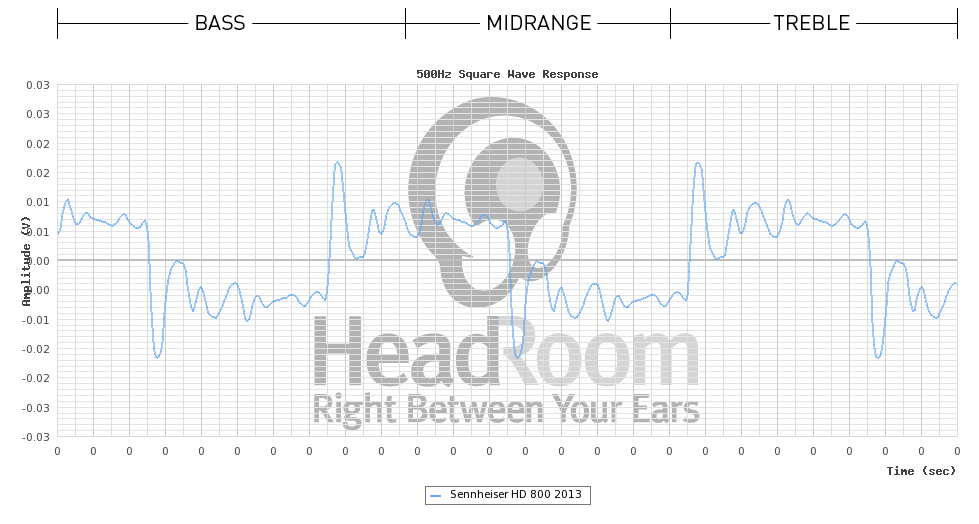
While frequency response graphs will tell you about the amplitude response of headphones at various frequencies, it doesn't tell you about the ability of the headphones to keep all differing frequency components lined up in time. For an audio signal to sound coherent and natural the high-speed edges of the signal need to travel through the system at the same speed as the low-frequency components.
When phase is smeared, the square wave starts to look quite ragged as all its components become misaligned. For the upper mid and treble frequencies, the 500 Hz square wave is very sensitive to phase errors.
50 Hz Square Wave Test
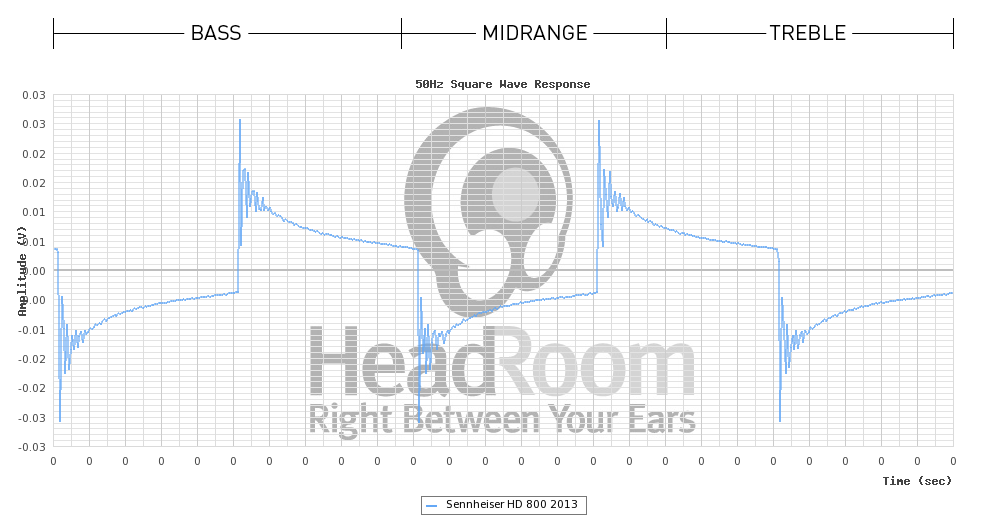
What it means: The principles are very similar to the high-frequency test, but the lower 50Hz square wave test tells you more about bass and low-mids performance.
How to interpret the line: The headphone's ability to maintain a constant pressure for the length of the flat top and bottom is a measure of how well it can reproduce low-frequency notes. This is very difficult as the driver is small with a limited excursion and the earcup is fairly leaky and lets pressure out easily. In no case we've observed has a headphone been able to keep a truly flat line; ear canal headphones can come the closest as they only have a small, sealed volume of air in the ear canal to compress. But the ability for the headphones to create a straight line at the top and bottom, even if it's tilted will indicate coherent performance in the lows. The noise at the edges is less important on this graph as it is more observable with the 500Hz square wave test.